Retail Direct Product Profitability DPP Calculation Formula: 6 Steps to Uncover True SKU Margin
In retail merchandising and multi-SKU inventory auditing, relying solely on Gross Margin Percentage (\( \text{GM}\% = (P - C)/P \)) creates a dangerous illusion of profitability. A bulky $20.00 home-goods or grocery SKU with a 45% gross margin ($9.00 gross profit) looks like a star performer on a standard income statement—until you audit the warehouse pallet footprint, cubic freight volume, slow 90-day shelf dwell time, fragile breakage, and manual restocking labor required to move each unit. Conversely, a compact $20.00 fast-moving consumable with a modest 22% gross margin ($4.40 gross profit) that turns every 10 days in 1/12th the shelf space often generates three times more bottom-line cash.
To expose hidden loss-leader SKUs, category managers use the retail direct product profitability DPP formula. Direct Product Profitability assigns itemized handling, storage, financing, and checkout costs directly to each individual SKU. In this six-step financial audit guide, we derive the complete DPP equation, walk through a side-by-side SKU waterfall comparison, and pair merchandising controls with front-end POS discipline using Retail Margin Calculator and Till Trainer.
Key Engineering & Financial Benchmarks
- The Master DPP Equation: Direct Product Profitability per unit is \( \text{DPP} = (P_{\text{net}} - C_{\text{invoice}} + A_{\text{rebate}}) - \text{DPC} \), where Direct Product Costs (\(\text{DPC}\)) sum warehouse, transport cube, store labor, inventory carrying, and shrinkage costs.
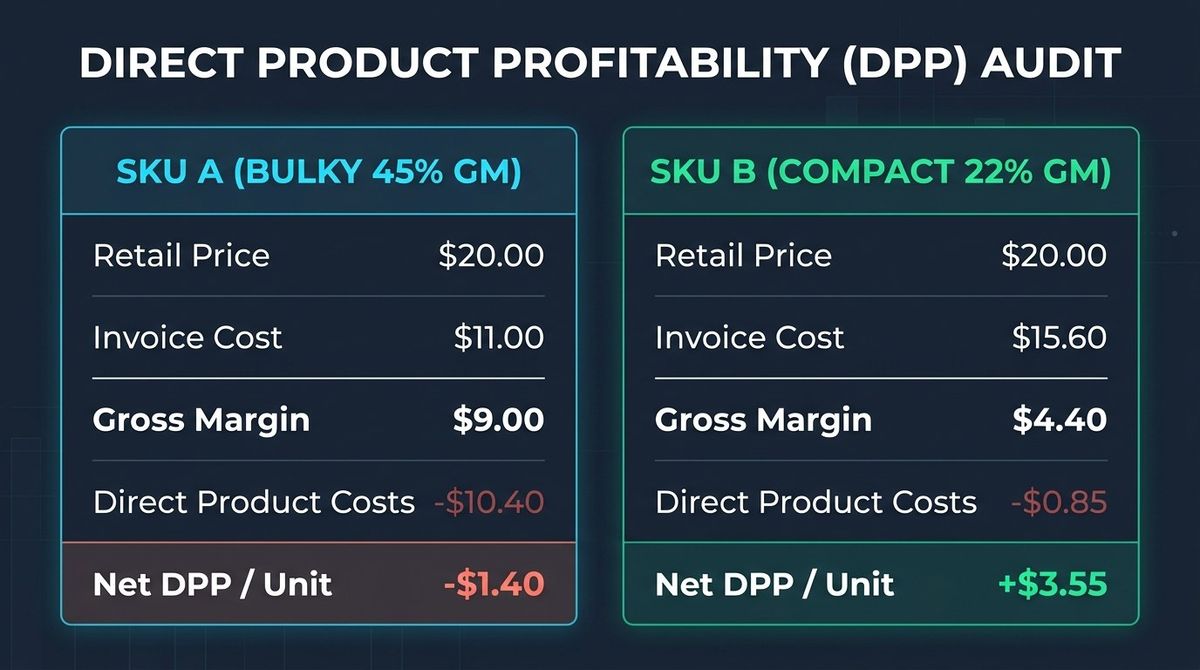
- The Bulky High-Margin Trap: A $20.00 bulky SKU at 45% gross margin ($9.00 GM) incurring $10.40 in cubic storage, handling, and carrying costs yields a net loss of \( 9.00 - 10.40 = \mathbf{-1.40} \) in USD per unit sold!
- The Compact Fast-Mover Winner: A $20.00 compact SKU at 22% gross margin ($4.40 GM) incurring just $0.85 in handling and storage yields a net profit of \( 4.40 - 0.85 = \mathbf{+3.55} \) in USD per unit sold.
- Volumetric Space Return (\(\text{DPP}/\text{ft}^3\)): Dividing weekly DPP dollars by shelf cubic footage reveals which SKUs deserve eye-level endcap placement.
1. The Master Retail Direct Product Profitability (DPP) Formula
While Gross Margin only subtracts supplier invoice cost (\( C_{\text{invoice}} \)) from net selling price (\( P_{\text{net}} \)), Direct Product Profitability (DPP) adds back supplier payment terms/allowances (\( A_{\text{rebate}} \)) and deducts all five variable Direct Product Costs (\(\text{DPC}\)) incurred between your loading dock and the customer's shopping bag:
- \( C_{\text{whse}} \) = Distribution center receiving, pallet-rack occupancy (\( V_{\text{cube}} \times D_{\text{whse}} \)), and case-picking labor per unit.
- \( C_{\text{trans}} \) = Inbound/store-transfer freight allocated by cubic displacement (\( V_{\text{cube}} \times R_{\text{freight/ft}^3} \)).
- \( C_{\text{store}} \) = Store backroom unpacking, shelf restocking labor, price-tagging, and checkout scan time (plus refrigeration kWh for chilled/frozen SKUs).
- \( C_{\text{hold}} \) = Working capital financing and insurance cost over total days in stock: \( C_{\text{invoice}} \cdot (r_{\text{WACC}} / 365) \cdot D_{\text{turn}} \).
- \( C_{\text{shrink}} \) = Item-specific breakage, expiration spoilage, and unrecorded POS discount leakage.
2. Worked Audit: Why a 45% Margin SKU Loses Money While a 22% Margin SKU Prints Cash
Suppose a specialty retailer audits two $20.00 retail SKUs discussed in r/smallbusiness inventory profitability reviews:
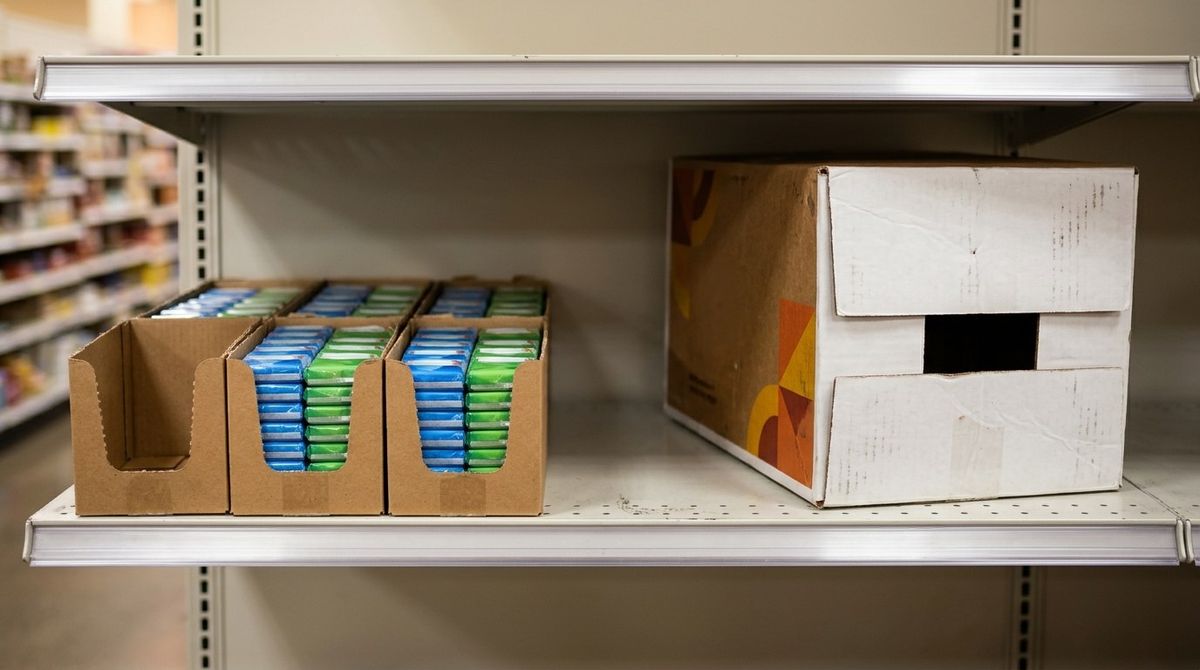
- SKU A (Bulky Glass Artisanal Beverage 12-Pack / Decor Box): Retail \( P = \$20.00 \), Invoice Cost \( C = \$11.00 \) (45.0% Gross Margin = $9.00). Takes up \( 1.8\text{ ft}^3 \) of warehouse/shelf space, requires two-handed fragile restocking, sits on shelves for 75 days, and suffers 4% glass breakage.
- SKU B (Compact Premium Espresso Pod Sleeve / Supplement Bottle): Retail \( P = \$20.00 \), Invoice Cost \( C = \$15.60 \) (22.0% Gross Margin = $4.40). Takes up just \( 0.08\text{ ft}^3 \), ships 48 units per master carton, turns every 12 days, and has near-zero breakage.
Let us compute the exact per-unit Direct Product Costs (\(\text{DPC}\)) and net DPP in USD:
- SKU A Direct Product Costs: Warehouse cube & pick ($2.85) + Cubic freight ($2.40) + Store restocking & bulky bagging labor ($3.10) + 75-day carrying cost & breakage ($2.05) = \( 2.85 + 2.40 + 3.10 + 2.05 = \mathbf{10.40} \) in USD. Net DPP: \( 9.00 - 10.40 = \mathbf{-1.40} \) in USD per unit!
- SKU B Direct Product Costs: Warehouse cube & pick ($0.18) + Cubic freight ($0.14) + Store shelf-pack restocking ($0.38) + 12-day carrying cost ($0.15) = \( 0.18 + 0.14 + 0.38 + 0.15 = \mathbf{0.85} \) in USD. Net DPP: \( 4.40 - 0.85 = \mathbf{+3.55} \) in USD per unit!
3. Complete SKU Direct Product Profitability Waterfall Table
Compare the full line-by-line cost allocation across both retail archetypes below:
| Financial Waterfall Line Item | SKU A: Bulky Slow-Mover (45% GM) | SKU B: Compact Fast-Mover (22% GM) | Audit Variance (SKU B vs A) |
|---|---|---|---|
| Retail Selling Price (\(P_{\text{net}}\)) | $20.00 | $20.00 | $0.00 (Identical price point) |
| Supplier Invoice Cost (\(C_{\text{invoice}}\)) | $11.00 | $15.60 | +$4.60 higher COGS on SKU B |
| Paper Gross Margin (\(\text{GM}\$\)) | $9.00 (45.0%) | $4.40 (22.0%) | -$4.60 lower paper margin |
| Warehouse & Freight Cube (\(C_{\text{whse}} + C_{\text{trans}}\)) | -$5.25 (1.80 sq/cu ft) | -$0.32 (0.08 sq/cu ft) | +$4.93 saved in cubic handling |
| Store Shelf Labor & Check-Out (\(C_{\text{store}}\)) | -$3.10 (Single-unit hand stock) | -$0.38 (Shelf-ready tray) | +$2.72 saved in store labor |
| Carrying Cost & Breakage (\(C_{\text{hold}} + C_{\text{shrink}}\)) | -$2.05 (75-day turn + fragile) | -$0.15 (12-day turn) | +$1.90 saved in capital drag |
| Total Direct Product Costs (\(\text{DPC}\)) | -$10.40 / unit | -$0.85 / unit | -$9.55 lower DPC per unit |
| Net Direct Product Profit (\(\text{DPP}\)) | -$1.40 / unit (-7.0% DPP) | +$3.55 / unit (+17.8% DPP) | +$4.95 net profit advantage! |
4. Protecting DPP at the Register: Till Trainer & Cashier Discount Controls
Even when your procurement team negotiates shelf-ready tray packaging that cuts \( C_{\text{store}} \) by 60%, your net DPP can still be wiped out in three seconds at the checkout lane. On a compact fast-moving item like SKU B yielding +$3.55 in net DPP ($20.00 retail), an unauthorized 20% cashier "price-match" or manual coupon override ($4.00 discount) immediately turns a +$3.55 net profit into a \( 3.55 - 4.00 = \mathbf{-0.45} \) net loss!
When onboarding retail cashiers and shift supervisors with interactive POS simulation platforms like Till Trainer, enforce three strict front-end DPP controls:
- Lock Manual Percentage Overrides Above 5%: Require a supervisor PIN badge scan for any manual discount exceeding the SKU's verified net DPP percentage.
- Enforce Barcode Multi-Pack Scanning: Train cashiers never to use the "Quantity × 1" key across mixed flavor variants, which corrupts SKU-level velocity (\( D_{\text{turn}} \)) and triggers phantom warehouse reorders.
- Audit Open-Box Damage Reason Codes at POS: Require cashiers to log damaged-packaging discounts under a dedicated supplier-chargeback code so your buyer can recover \( C_{\text{shrink}} \) during quarterly vendor reviews.
5. Frequently Asked Questions (FAQ)
How is Direct Product Profitability (DPP) different from GMROI?
Gross Margin Return on Inventory Investment (GMROI) measures how many gross margin dollars you earn per dollar tied up in average inventory cost, but it ignores physical cubic size and handling labor. DPP subtracts warehouse cube, freight, store restocking labor, and carrying costs directly from gross margin to reveal true net profit per unit and per cubic foot of shelf space.
How do I turn a negative-DPP bulky product into a profitable SKU?
You have four levers: raise the retail price by 15% to 20%, require the vendor to ship in shelf-ready display trays or drop-ship directly to customers, cut safety stock to reduce warehouse dwell days, or delist the bulky SKU and reallocate its shelf footage to high-velocity compact goods.
Should refrigerated and frozen retail items have a higher gross margin floor?
Yes. Because commercial display freezers and open multi-deck chillers consume continuous electricity and require temperature-monitored cold-chain receiving, chilled and frozen SKUs incur $0.45 to $1.20 higher Direct Product Costs per unit than ambient dry-grocery equivalents.
6. Standard Operating Verification & Audit Checklist
Before locking in your final configuration or production parameters for retail direct product profitability dpp formula, execute this five-point verification protocol across your workspace and accounting records to ensure repeatable field performance:
- Cubic Volume & Pallet Footprint Measurement: Measure master-carton and individual unit dimensions (L × W × H in cubic feet) for every SKU to replace flat-percentage overhead guesses with true volumetric allocation.
- Shelf-Ready Packaging & Touch-Labor Timing: Time store restocking labor per case and negotiate shelf-ready display trays with suppliers on high-velocity SKUs to cut store handling cost by up to 60%.
- Inventory Dwell & Carrying Cost Audit: Multiply unit invoice cost by (WACC / 365 × Days-to-Sell) to expose slow-moving bulky items that silently drain working capital.
- Till Trainer POS Discount & Override Lockout: Configure POS permission rules and train cashiers via Till Trainer so manual register discounts never exceed the SKU's verified net DPP margin.
- Volumetric DPP per Cubic Foot Ranking: Run your top 50 SKUs through the Retail Margin & DPP Calculator below and reallocate eye-level endcap space to items with the highest weekly DPP/ft³.
Model Your Exact Parameters & Tolerances
Run your custom numbers through our interactive engineering and financial calculator to verify your setup in real time.