Retail Gross Margin Return on Floor Space (GMROF) Formula: Why Sales Per Square Foot Misleads Planograms
Brick-and-mortar retail operators routinely allocate prime floor real estate based on raw Sales Per Square Foot \( \left( \text{SPSF} \right) \). However, evaluating departments or sub-tenant concessions solely on top-line revenue per square foot ignores gross margin percentage \( \left( \text{GM}\% \right) \)—often rewarding high-volume, heavily discounted categories that fail to cover triple-net \( \left( \text{NNN} \right) \) commercial lease rates. The superior merchandising metric is Gross Margin Return on Floor Space \( \left( \text{GMROF} \right) \), which measures exact gross margin dollars generated per square foot of selling space per year. When auditing a specialty store where a \( 200\text{ sq ft} \) Standard Apparel Fixture generates \( \$420\text{/sq ft} \) in sales at \( 52\% \) Gross Margin \( \left( \text{GMROF} = \$218.40\text{/sq ft} \right) \) while a \( 50\text{ sq ft} \) High-Margin Accessories Endcap generates \( \$680\text{/sq ft} \) in sales at \( 65\% \) Gross Margin \( \left( \text{GMROF} = \$442.00\text{/sq ft} \right) \), the accessories zone delivers \( 2.02\times \) higher gross profit per square foot. This financial guide derives the complete GMROF formula, circulation-area allocation math, and floor reallocation ROI.

The Exact GMROF Mathematical Formula
Gross Margin Return on Floor Space \( \left( \text{GMROF} \right) \) is defined as total annual Gross Margin Dollars \( \left( \text{GM}_{\$} = \text{Net Sales} - \text{COGS} \right) \) divided by allocated selling floor area \( A_{\text{selling}} \) (in square feet):
\[ \text{GMROF} = \frac{\text{Gross Margin Dollars}}{\text{Allocated Selling Area } \left( \text{sq ft} \right)} = \frac{\text{Net Sales} - \text{COGS}}{A_{\text{selling}}} \]Because \(\text{Gross Margin Dollars} = \text{Net Sales} \times \text{GM}\%\) and \(\text{Sales Per Square Foot } \left( \text{SPSF} \right) = \frac{\text{Net Sales}}{A_{\text{selling}}}\), we can express \(\text{GMROF}\) as the direct product of top-line space productivity and gross margin percentage:
\[ \text{GMROF} = \left( \frac{\text{Net Sales}}{A_{\text{selling}}} \right) \times \text{GM}\% = \text{SPSF} \times \text{GM}\% \]This two-factor decomposition proves that a category with moderate top-line sales density \( \left( \text{SPSF} = \$500\text{/sq ft} \right) \) at a high private-label margin \( \left( \text{GM}\% = 68\% \implies \text{GMROF} = \$340.00\text{/sq ft} \right) \) outperforms a national-brand category generating \( \$750\text{/sq ft} \) in sales at a narrow \( 38\% \) margin \( \left( \text{GMROF} = \$285.00\text{/sq ft} \right) \) by \( +\$55.00\text{/sq ft} \) in pure cash contribution.
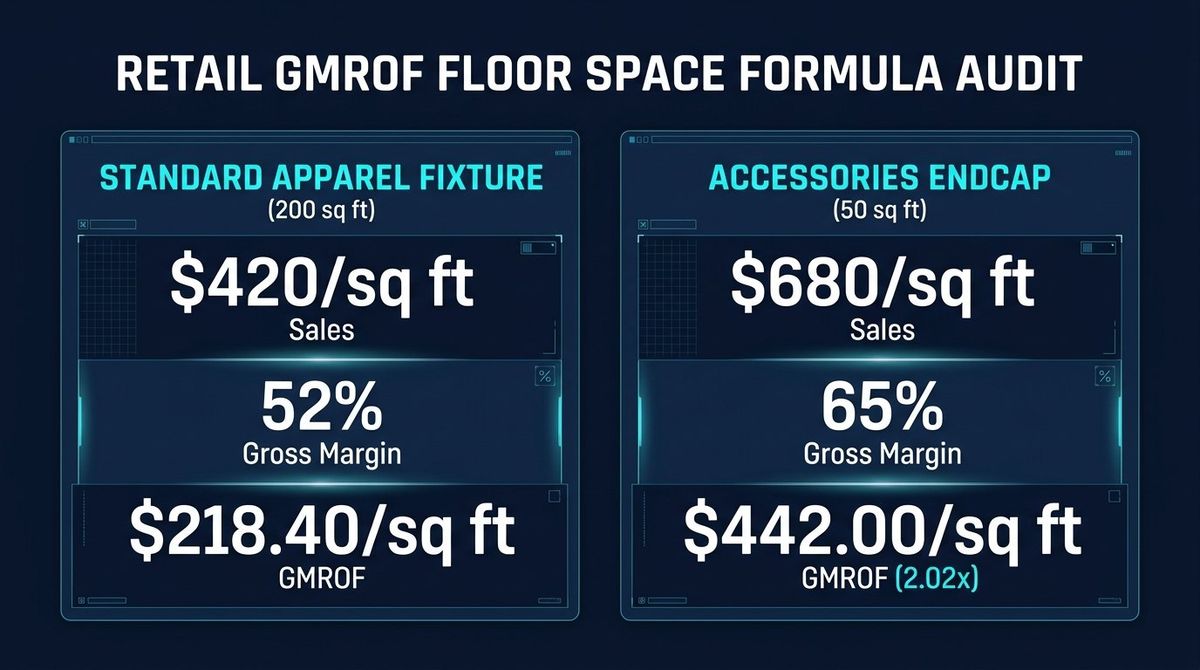
Worked Store Audit: $218.40/sq ft Apparel Fixture vs. $442.00/sq ft Accessories Endcap
Consider a \( 2{,}400\text{ sq ft} \) specialty retail boutique paying an annual occupancy cost (base rent + NNN CAM/tax/insurance + utilities) of \( \$42.00\text{/sq ft}\cdot\text{yr} \) across gross leased area. Within the front merchandising zone, the store manager audits two adjacent fixtures:
Zone A — Standard Apparel Fixture (\( A_{\text{apparel}} = 200\text{ sq ft} \)):
- Annual Net Sales: \( \$84{,}000\text{/yr} \)
- Sales Per Square Foot \( \left( \text{SPSF} \right) \): \( \frac{\$84{,}000}{200\text{ sq ft}} = \$420.00\text{/sq ft} \)
- Gross Margin Percentage \( \left( \text{GM}\% \right) \): \( 52.0\% \) (\( \text{COGS} = \$40{,}320 \), \(\text{Gross Margin Dollars} = \$43{,}680\))
- Department GMROF: \[ \text{GMROF}_{\text{apparel}} = \$420.00\text{/sq ft} \times 0.52 = \$218.40\text{/sq ft} \quad \left( \frac{\$43{,}680}{200\text{ sq ft}} = \$218.40\text{/sq ft} \right) \]
Zone B — High-Margin Accessories Endcap (\( A_{\text{acc}} = 50\text{ sq ft} \)):
- Annual Net Sales: \( \$34{,}000\text{/yr} \)
- Sales Per Square Foot \( \left( \text{SPSF} \right) \): \( \frac{\$34{,}000}{50\text{ sq ft}} = \$680.00\text{/sq ft} \)
- Gross Margin Percentage \( \left( \text{GM}\% \right) \): \( 65.0\% \) (\( \text{COGS} = \$11{,}900 \), \(\text{Gross Margin Dollars} = \$22{,}100\))
- Department GMROF: \[ \text{GMROF}_{\text{acc}} = \$680.00\text{/sq ft} \times 0.65 = \$442.00\text{/sq ft} \quad \left( \frac{\$22{,}100}{50\text{ sq ft}} = \$442.00\text{/sq ft} \right) \]
Dividing the accessories GMROF by the apparel GMROF reveals a \( 2.02\times \) floor efficiency multiplier \( \left( \frac{\$442.00}{\$218.40} = 2.0238\times \right) \).
Reallocating 40 sq ft of Floor Space: Net Annual Profit Gain
Suppose the retailer reallocates \( \Delta A = 40\text{ sq ft} \) of underperforming apparel rack space (reducing Zone A from \( 200\text{ sq ft} \) to \( 160\text{ sq ft} \)) to expand high-margin accessories and impulse checkout fixtures (growing Zone B from \( 50\text{ sq ft} \) to \( 90\text{ sq ft} \)). Even if the expanded accessories footprint experiences a conservative \( 10\% \) marginal dilution on the added \( 40\text{ sq ft} \) \( \left( \text{GMROF}_{\text{marginal}} = \$397.80\text{/sq ft} \right) \), or holds the full \( \$442.00\text{/sq ft} \) rate, the net annual gross margin gain \( \Delta \text{GM}_{\$} \) with zero increase in store rent is:
\[ \Delta \text{GM}_{\$,\text{full}} = 40\text{ sq ft} \times \left( \$442.00\text{/sq ft} - \$218.40\text{/sq ft} \right) = 40 \times \$223.60 = +\$8{,}944.00\text{/yr} \] \[ \Delta \text{GM}_{\$,\text{diluted}} = 40\text{ sq ft} \times \left( \$397.80\text{/sq ft} - \$218.40\text{/sq ft} \right) = 40 \times \$179.40 = +\$7{,}176.00\text{/yr} \]
Gross Leased Area (GLA) vs. Net Selling Area (NSA) Burden Factor
When setting a store-wide minimum \(\text{GMROF}_{\text{min}}\) hurdle rate, remember that back-of-house stockrooms, fitting rooms, restrooms, and POS counters consume \( 20\% \) to \( 30\% \) of Gross Leased Area \( \left( \text{GLA} \right) \). If a \( 2{,}400\text{ sq ft} \) store has \( 1{,}800\text{ sq ft} \) of Net Selling Area \( \left( \text{NSA} = 75\% \text{ of GLA} \right) \), every \( 1.0\text{ sq ft} \) of selling fixture must carry a \( \frac{2{,}400}{1{,}800} = 1.333\times \) occupancy burden multiplier:
\[ \text{GMROF}_{\text{break-even}} = \frac{\text{Total Occupancy} + \text{Store Labor} + \text{Fixed OpEx}}{\text{Net Selling Area } \left( \text{NSA} \right)} \]Complete Retail Category GMROF Benchmark Table
| Merchandising Zone / Category | Allocated Area \( \left( \text{sq ft} \right) \) | Sales / sq ft \( \left( \text{SPSF} \right) \) | Gross Margin \( \left( \text{GM}\% \right) \) | Annual Gross Margin \( \left( \$ \right) \) | GMROF \( \left( \$\text{/sq ft} \right) \) |
|---|---|---|---|---|---|
| Clearance / Bulk Seasonal Tables | \( 150\text{ sq ft} \) | \( \$310.00\text{/sq ft} \) | \( 28.0\% \) | \( \$13{,}020 \) | \( \$86.80\text{/sq ft} \) |
| Standard Apparel Fixture (Baseline) | \( 200\text{ sq ft} \) | \( \$420.00\text{/sq ft} \) | \( 52.0\% \) | \( \$43{,}680 \) | \( \$218.40\text{/sq ft} \) |
| Specialty Footwear / Sub-Department | \( 400\text{ sq ft} \) | \( \$550.00\text{/sq ft} \) | \( 54.0\% \) | \( \$118{,}800 \) | \( \$297.00\text{/sq ft} \) |
| High-Margin Accessories Endcap | \( 50\text{ sq ft} \) | \( \$680.00\text{/sq ft} \) | \( 65.0\% \) | \( \$22{,}100 \) | \( \$442.00\text{/sq ft} \) (\(2.02\times\)) |
Combining GMROF with GMROI for Complete Inventory & Floor Efficiency
For multi-category retail buyers, pairing Gross Margin Return on Floor Space \( \left( \text{GMROF} \right) \) with Gross Margin Return on Inventory Investment \( \left( \text{GMROI} = \frac{\text{Gross Margin Dollars}}{\text{Average Inventory Cost}} \right) \) creates a complete two-dimensional merchandising scorecard. While \(\text{GMROF}\) audits physical real estate productivity (\( \$218.40\text{/sq ft} \) on the \( 200\text{ sq ft} \) apparel fixture vs. \( \$442.00\text{/sq ft} \) on the \( 50\text{ sq ft} \) accessories endcap), \(\text{GMROI}\) audits working capital velocity. A department that clears both the store's \(\text{GMROF} \ge \$300\text{/sq ft}\) floor hurdle and \(\text{GMROI} \ge \$3.20\text{ per }\$1.00\) of inventory cost deserves immediate planogram expansion during quarterly resets.