Retail Gross Margin Return on Labor GMROL Calculation Formula: 6 Staffing Productivity and Payroll Audit Steps
In brick-and-mortar retail management, store payroll represents the single largest controllable operating expense. Retail store operators frequently evaluate labor performance using simplistic top-line metrics like Sales Per Hour (SPH) or Payroll as a Percentage of Sales. However, these traditional measures possess a fatal blind spot: they measure revenue volume rather than gross margin generation. An associate selling high volumes of discounted, low-margin promotional goods may show an impressive SPH while generating virtually zero net profit to cover store overhead.
To align labor deployment with true business profitability, enterprise retailers utilize Gross Margin Return on Labor (GMROL). GMROL measures the exact gross profit dollars generated for every single dollar invested in direct store labor. By connecting inventory contribution margins directly with associate scheduling hours, store managers can identify underperforming shifts, optimize high-margin consultative sales departments, and establish data-driven wage floors. This financial guide delivers the comprehensive mathematical framework and audit steps to implement GMROL across your retail network.
Quick Answer & Financial Benchmarks:
- The Core GMROL Multiple: \(\text{GMROL} = \frac{\text{Gross Margin Dollars}}{\text{Direct Labor Payroll Dollars}}\). A healthy specialty retail benchmark is $2.80 to $4.50 in gross margin per labor dollar.
- GMROL per Labor Hour: \(\text{GMROL}_{\text{hour}} = \frac{\text{Total Gross Margin}}{\text{Total Labor Hours Worked}}\). Measures direct gross margin velocity per associate working hour.
- Contribution Margin Return on Labor (CMROL): Incorporates direct selling costs and commissions to evaluate net department profitability.
- Maximum Breakeven Wage: Calculates the highest sustainable hourly wage a department can absorb before labor costs consume all gross margin contribution.
- Interactive Margin Tools: Model store gross margins, inventory turnover, and payroll ratios with our Retail Margin Calculator platform.
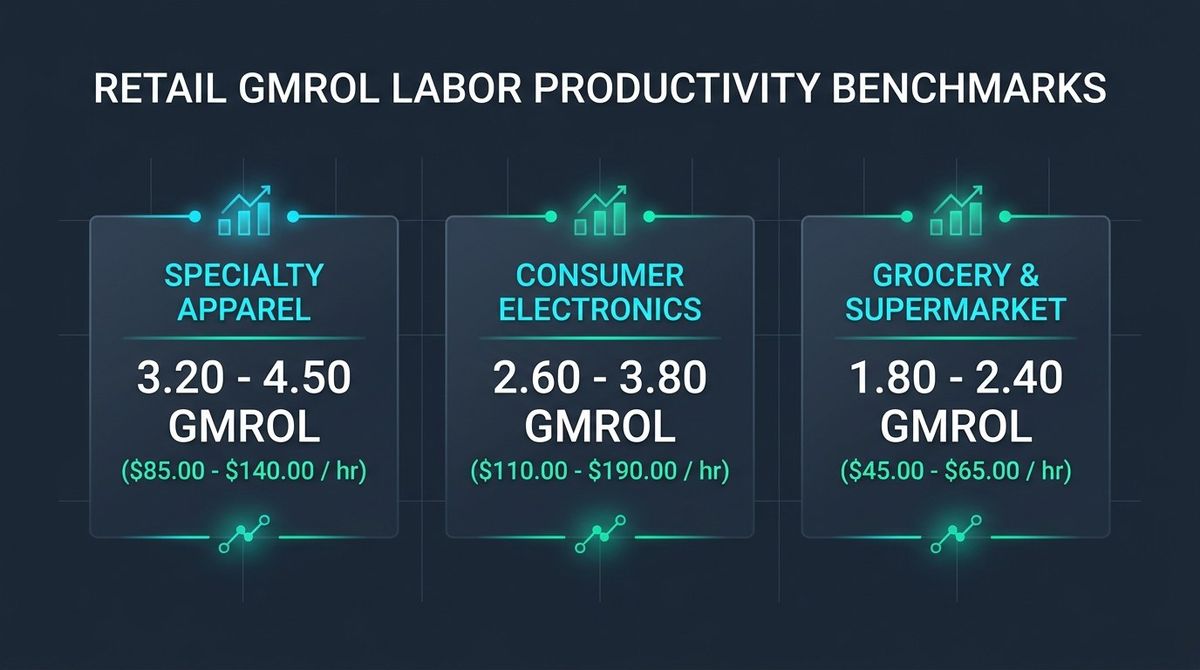
Figure 1: Retail financial architecture connecting inventory gross margin, employee hourly scheduling, and payroll return ratios.
1. The Fundamental GMROL Multiple Formula
The standard Gross Margin Return on Labor multiple expresses the ratio between realized gross margin dollars and total direct payroll expenses incurred over a designated operating period (week, month, or quarter):
\[ \text{GMROL} = \frac{\text{Gross Margin Dollars}}{\text{Direct Labor Cost}} = \frac{\text{Net Sales} - \text{COGS}}{\text{Total Direct Payroll}} \]Consider a specialty electronics store with monthly sales of $185,000, cost of goods sold (COGS) of $105,000, and direct sales floor payroll expenses of $22,500:
\[ \text{Gross Margin} = \$185,000 - \$105,000 = \$80,000 \] \[ \text{GMROL} = \frac{\$80,000}{\$22,500} = 3.56 \]This result demonstrates that for every $1.00 invested in direct sales payroll, the store generates $3.56 in gross margin profit. If GMROL drops below 2.00, store labor is consuming more than 50% of realized gross profits, leaving insufficient capital to cover rent, utilities, insurance, and net profit margins.
2. Gross Margin Generated per Selling Hour
To evaluate individual shift efficiency and prevent over-staffing during low-traffic periods, retail analysts break GMROL down into hourly margin velocity \(\text{GMROL}_{\text{hour}}\):
\[ \text{GMROL}_{\text{hour}} = \frac{\text{Gross Margin Dollars}}{H_{\text{worked}}} = \frac{\text{Net Sales} \times \text{GM}\%}{H_{\text{worked}}} \]Where \(H_{\text{worked}}\) represents the total aggregate associate hours scheduled. If a Saturday shift of 6 associates working 8 hours each (48 total labor hours) generates $14,400 in net sales at a 44% gross margin ($6,336 gross margin dollars):
\[ \text{GMROL}_{\text{hour}} = \frac{\$6,336}{48\text{ hours}} = \$132.00\text{ per labor hour} \]Comparing this to a Tuesday shift generating only $34.00 of gross margin per labor hour reveals an immediate scheduling misalignment, signaling that associate hours should be shifted to peak weekend foot-traffic windows.

Figure 2: Hourly customer foot-traffic curves, department gross margin contribution, and breakeven labor allocation lines.
3. Departmental Contribution Margin on Labor (CMROL)
In retail formats featuring commissions, specialized product certifications, or variable bonuses, direct wage costs must be expanded to include all selling expenses. The Contribution Margin Return on Labor (CMROL) isolates true net departmental contribution:
\[ \text{CMROL} = \frac{\text{Gross Margin} - \text{Variable Selling Expenses}}{\text{Direct Labor Cost} + \text{Payroll Taxes} + \text{Benefits}} \]This metric prevents departments with high associate commissions (such as luxury jewelry or bespoke footwear) from showing artificially inflated returns when underlying fulfillment costs are substantial.
4. Retail Sector GMROL Benchmark Matrix
| Retail Sector | Target GMROL Multiple | Target Margin per Hour | Primary Labor Productivity Driver |
|---|---|---|---|
| Specialty Apparel & Footwear | 3.20 – 4.50 | $85.00 – $140.00 | Units Per Transaction (UPT) and styling cross-sell |
| Consumer Electronics & Appliances | 2.60 – 3.80 | $110.00 – $190.00 | High-margin warranty and accessory attachments |
| Luxury & Fine Jewelry | 4.50 – 7.00 | $220.00 – $450.00 | Consultative relationship selling and high AOV |
| Home Improvement & Hardware | 2.40 – 3.20 | $65.00 – $95.00 | Task-based inventory stocking and pro-desk sales |
| Grocery & Supermarket | 1.80 – 2.40 | $45.00 – $65.00 | Cashier scan speed and automated self-checkout |
5. Maximum Sustainable Wage Threshold Formula
To establish competitive compensation packages without threatening store solvency, calculate the maximum allowable hourly wage \(W_{\text{max}}\) a department can pay while maintaining a target GMROL multiple \(\text{GMROL}_{\text{target}}\):
\[ W_{\text{max}} = \frac{\text{GMROL}_{\text{hour}}}{\text{GMROL}_{\text{target}}} \]If an enterprise department generates $120.00 in gross margin per associate hour and requires a minimum GMROL multiple of 3.50 to cover store overhead and profit targets:
\[ W_{\text{max}} = \frac{\$120.00}{3.50} = \$34.28\text{ per hour (fully burdened)} \]This provides an exact ceiling for wages plus payroll taxes, guiding performance-based commission structures. Model your complete store financial metrics using the Retail Margin Calculator platform.
5. Staffing Elasticity and Customer Conversion Lift Models
A frequent error made by retail operations teams is cutting labor hours indiscriminately across all operating days to hit arbitrary payroll percentage targets. However, labor reduction in consultative retail formats often creates a negative revenue spiral: under-staffed stores result in unassisted shoppers, long checkout queues, and abandoned shopping baskets, causing gross margin dollars to drop faster than payroll savings.
The elasticity of gross margin with respect to labor hours \(E_{\text{labor}}\) is expressed as:
\[ E_{\text{labor}} = \frac{\% \Delta \text{Gross Margin}}{\% \Delta \text{Labor Hours Worked}} \]If a store cuts sales floor hours by 10% during peak Saturday trading and experiences a 14% collapse in realized gross margin dollars, \(E_{\text{labor}} = 1.4\), confirming an elastic relationship where payroll reductions actively destroy net profitability. By monitoring GMROL dynamically by shift segment, store directors can allocate additional associate hours specifically to high-conversion windows where incremental labor delivers a 4.0x+ return on investment.
6. Merchandising Cross-Elasticity and Basket Size Expansion
High GMROL performance is directly tied to an associate's ability to drive multi-item transactions. When associates bundle high-margin accessories (such as premium cables, protective cases, or maintenance warranties) alongside low-margin anchor hardware, the blended gross margin of the sales basket increases dramatically.
Every additional 0.2 increase in Units Per Transaction (UPT) lifts department GMROL by approximately 18% to 25%, allowing the store to absorb higher hourly wages while maintaining strong net operating margins.
7. Standard Operating Verification & Payroll Audit Checklist
- Reconcile POS gross margin reporting with actual payroll punch records on a weekly Monday morning audit cycle.
- Isolate promotional and clearance sales to ensure discounted volume does not mask deteriorating labor margins.
- Calculate individual department GMROL to identify high-margin staffing deficits during peak afternoon foot traffic.
- Audit employee commission tiers against contribution margin thresholds to avoid paying incentives on unprofitable inventory.
- Conduct monthly schedule realignments, shifting 10% to 15% of total store labor hours from low-GMROL weekday mornings to high-velocity weekend windows.
Master Your Retail Profitability Metrics
Calculate gross margins, initial markup percentages, inventory turnover, and GMROI with our enterprise retail calculators.
Access Retail Margin Calculator