Retail Units Per Transaction UPT Calculation Formula: 6 Audit Steps to Expand Average Basket Size
Key Engineering & Operational Benchmarks
- The Core Net UPT Formula: Retail Units Per Transaction is calculated from net POS register receipts as \( \text{UPT} = \frac{U_{\text{gross}} - U_{\text{returns}} - U_{\text{voids}}}{N_{\text{tx}}} \), isolating physical basket depth from price inflation.
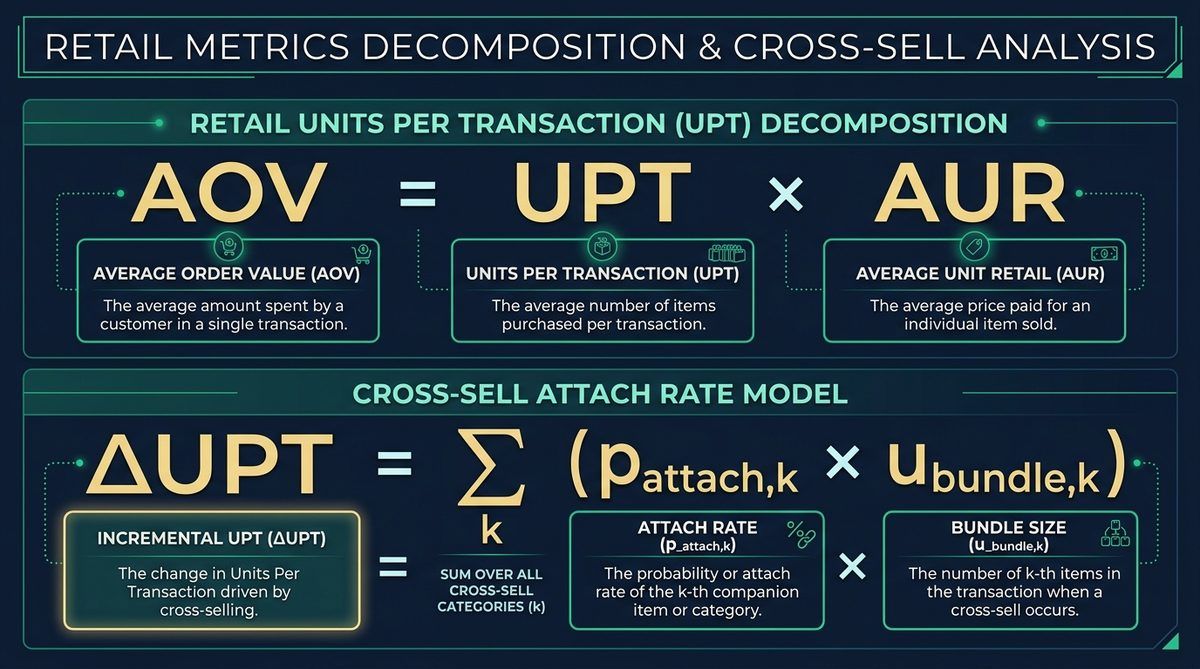
- The Multiplicative AOV Identity: Average Order Value decomposes strictly into \( \text{AOV} = \text{UPT} \times \text{AUR} \) (Units Per Transaction × Average Unit Retail), meaning a \( +15\% \) lift in UPT at constant AUR expands top-line store revenue by \( \mathbf{+15\%} \) with zero extra customer acquisition cost.
- Margin-Accretive Attach Math: Pairing a 72%-margin care accessory (\( \$12\text{ AUR} \)) onto 28% of single-item footwear transactions lifts storewide UPT by \( +0.28\text{ units} \) and increases blended Gross Margin % by \( \mathbf{+1.85\text{ percentage points}} \).
- Multi-Buy Discount Break-Even Rule: A 'Buy 3, Save 15%' promotion on a 55%-margin category requires a minimum UPT lift from \( 1.40 \) to \( \mathbf{1.91\text{ units}} \) to remain gross-margin-dollar neutral per customer.
- Till-Queue Impulse ROI: Re-merchandising the final 6 feet before the POS terminal with sub-$15 problem-solving add-ons typically lifts brick-and-mortar UPT from \( 1.65 \) to \( \mathbf{2.10+\text{ units}} \) within 30 days.
1. Audit Step 1 & 2: Net UPT Formula & The Multiplicative AOV = UPT × AUR Identity
In both brick-and-mortar specialty retail and direct-to-consumer (DTC) e-commerce, store owners frequently celebrate a rising Average Order Value (AOV) without realizing that inflation-driven price hikes have masked a shrinking physical basket. To audit true merchandising health in Step 1, calculate Net Units Per Transaction (UPT) by stripping out post-purchase returns (\( U_{\text{returns}} \)), register line voids (\( U_{\text{voids}} \)), and zero-margin free promotional samples (\( U_{\text{samples}} \)) across total completed customer transactions (\( N_{\text{tx}} \)):
$$ \text{UPT}_{\text{net}} = \frac{U_{\text{gross}} - U_{\text{returns}} - U_{\text{voids}} - U_{\text{samples}}}{N_{\text{tx}}} $$In Step 2, decompose your store's Average Order Value (\( \text{AOV} \)) and Total Store Revenue (\( R_{\text{total}} \)) into its four multiplicative retail levers—store foot traffic (\( T_{\text{traffic}} \)), conversion rate (\( \text{CR} \)), Units Per Transaction (\( \text{UPT} \)), and Average Unit Retail price (\( \text{AUR} \)):
$$ \text{AOV} = \text{UPT} \times \text{AUR}, \qquad R_{\text{total}} = T_{\text{traffic}} \times \text{CR} \times \text{UPT} \times \text{AUR} $$Consider a specialty boutique generating \( N_{\text{tx}} = 2{,}500 \) monthly transactions with an initial \( \text{UPT}_{0} = 1.68\text{ units} \) and \( \text{AUR}_{0} = \$34.00 \) (\( \text{AOV}_{0} = 1.68 \times 34.00 = \$57.12 \), monthly revenue \( = \$142{,}800 \)). If the store trains associates on checkout cross-selling and lifts \( \text{UPT}_{1} \) to \( 2.05\text{ units} \) (\( +0.37\text{ units/basket} \)) even while blended \( \text{AUR}_{1} \) dips slightly to \( \$31.50 \) due to lower-priced impulse add-ons, new AOV jumps to \( 2.05 \times 31.50 = \mathbf{\$64.58} \)—generating +$18,637.50/month (+$223,650/year) in incremental revenue from the exact same foot traffic.
2. Audit Step 3 & 4: Cross-Sell Attach Rate Math & Blended Gross Margin Dollars
Not all additional units are created equal: adding a clearance item at a negative margin inflates UPT while destroying profitability, whereas attaching high-margin consumables expands both UPT and Gross Margin Percentage. In Step 3, we model incremental basket expansion (\( \Delta \text{UPT} \)) and new blended Gross Margin Dollars per Transaction (\( \text{GM\$}_{\text{tx}} \)) across \( K \) cross-sell companion categories:
$$ \Delta \text{UPT} = \sum_{k=1}^{K} p_{\text{attach},k} \cdot u_{\text{bundle},k}, \qquad \text{GM\$}_{\text{tx}} = \left(\text{UPT}_{0} \cdot \text{AUR}_{0} \cdot m_{0}\right) + \sum_{k=1}^{K} p_{\text{attach},k} \cdot u_{\text{bundle},k} \cdot \text{AUR}_{k} \cdot m_{k} $$Where \( p_{\text{attach},k} \) is the probability that a customer buying an anchor item also adds companion item \( k \), \( u_{\text{bundle},k} \) is the number of companion units added, and \( m_{k} \) is the gross margin percentage of companion item \( k \). Let us run a Step 4 Footwear & Apparel audit:
- Anchor Basket: 1 pair of leather boots (\( \text{UPT}_{0} = 1.00 \), \( \text{AUR}_{0} = \$140.00 \), gross margin \( m_{0} = 50.0\% \rightarrow \text{GM\$}_{0} = \$70.00 \)).
- Companion Tier 1 (Waterproofing Spray @ $15, \( m_{1} = 74\% \)): Cashier suggestive prompt achieves \( p_{\text{attach},1} = 28\% \) (\( +0.28\text{ UPT} \), \( +\$3.11\text{ GM\$} \)).
- Companion Tier 2 (2-Pack Merino Socks @ $24, \( m_{2} = 68\% \)): Point-of-display adjacency achieves \( p_{\text{attach},2} = 22\% \) (\( +0.22\text{ UPT} \), \( +\$3.59\text{ GM\$} \)).
Combined, store UPT rises from \( 1.00 \) to \( \mathbf{1.50\text{ units}} \), AOV climbs from \( \$140.00 \) to \( \mathbf{\$149.48} \), and Gross Margin per Transaction jumps from \( \$70.00 \) to \( \mathbf{\$76.70} \) (\( +9.6\% \) net profit lift per checkout).
3. Audit Step 5: Tiered Multi-Buy Discount Break-Even UPT Threshold
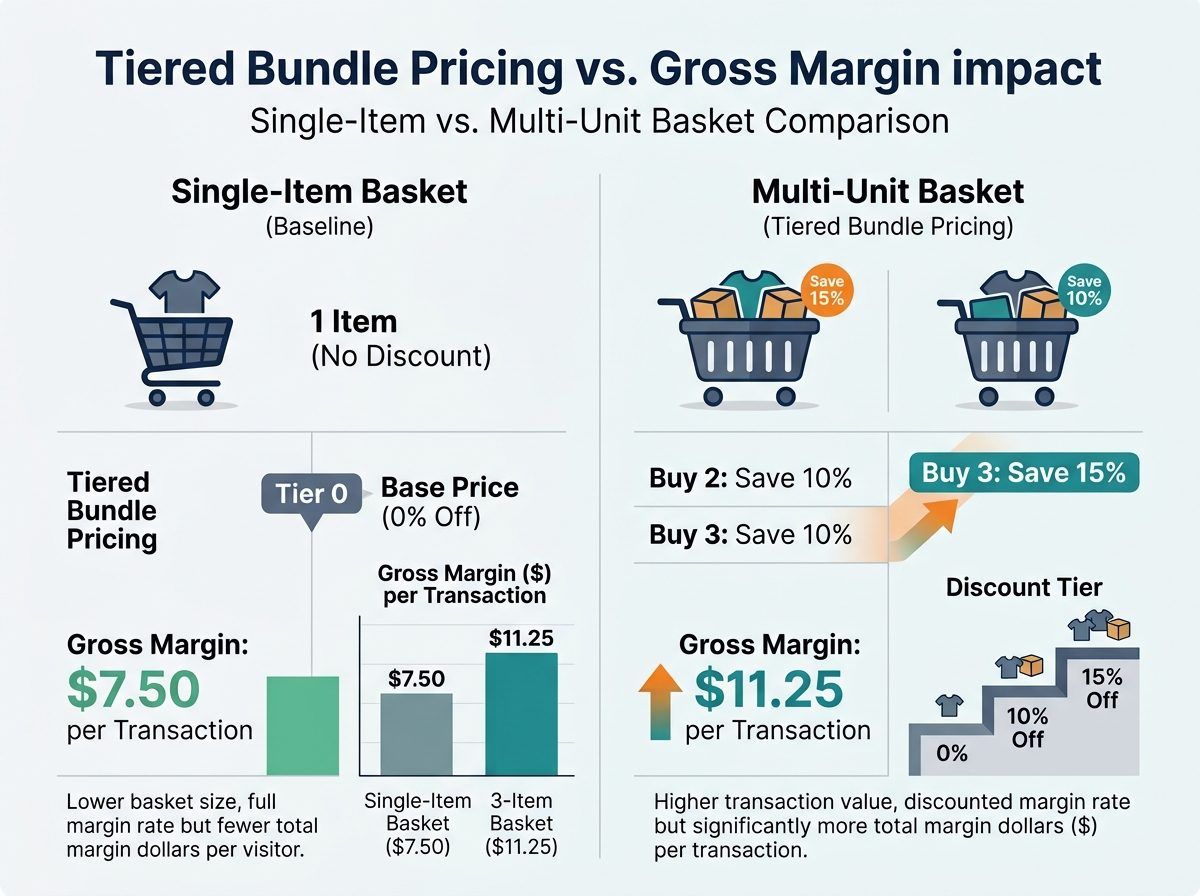
Before launching a storewide "Buy 2 Save 10%, Buy 3 Save 15%" promotion—or setting an e-commerce Free Shipping threshold—you must calculate the exact Break-Even UPT (\( \text{UPT}_{\text{BE}} \)) required so the promotional discount percentage (\( d_{\text{promo}} \)) does not reduce your gross margin dollars per transaction below baseline (\( \text{GM\$}_{0} \)):
$$ \text{UPT}_{\text{BE}} = \text{UPT}_{0} \cdot \left(\frac{m_{0}}{m_{0} - d_{\text{promo}}}\right) $$Suppose your baseline category has a gross margin of \( m_{0} = 55.0\% \) (\( 0.55 \)) and a current average basket of \( \text{UPT}_{0} = 1.40\text{ units} \):
- At a 10% Multi-Buy Discount (\( d_{\text{promo}} = 0.10 \)): $$ \text{UPT}_{\text{BE},10\%} = 1.40 \times \left(\frac{0.55}{0.55 - 0.10}\right) = 1.40 \times 1.222 = \mathbf{1.71\text{ units/tx}} $$
- At a 15% Multi-Buy Discount (\( d_{\text{promo}} = 0.15 \)): $$ \text{UPT}_{\text{BE},15\%} = 1.40 \times \left(\frac{0.55}{0.55 - 0.15}\right) = 1.40 \times 1.375 = \mathbf{1.93\text{ units/tx}} $$
Because customers claiming a "Buy 3, Save 15%" tier must purchase at least \( 3.00\text{ units} \) (well above the \( 1.93\text{ unit} \) break-even floor), gating the 15% discount strictly behind a 3-unit threshold guarantees a positive surge in gross margin dollars on every qualifying basket!
| Retail Vertical / Store Format | Baseline UPT Benchmark | Top-Quartile Optimized UPT | Primary Basket-Expansion Lever |
|---|---|---|---|
| Specialty Apparel & Footwear | 1.65 – 1.85 units / tx | 2.35 – 2.70 units / tx | Complete-the-look fitting room & sock/care attach |
| Beauty, Cosmetics & Skincare | 2.20 – 2.55 units / tx | 3.40 – 4.10 units / tx | 3-step regimen bundling + travel-size checkout queue |
| Hardware, Home & Garden | 2.80 – 3.20 units / tx | 4.25 – 4.90 units / tx | Project-kit adjacency (brushes + tape + primer) |
| Pet Specialty Retail | 2.45 – 2.90 units / tx | 3.80 – 4.40 units / tx | Mix-and-match treat multi-buys ('Buy 3 Get 1 Free') |
| Sporting Goods & Pro Shops | 1.50 – 1.75 units / tx | 2.25 – 2.60 units / tx | Consumable attach (balls, grips, hydration, wax) |
| Gift, Stationery & Toy Boutiques | 1.90 – 2.20 units / tx | 2.95 – 3.50 units / tx | Greeting card + gift wrap + tiered impulse table |
| DTC E-Commerce (Single-Category) | 1.35 – 1.55 units / tx | 2.05 – 2.45 units / tx | Free-shipping threshold bar + 1-click in-cart upsell |
4. Audit Step 6: POS Associate Scorecard & Free-Shipping Threshold Calibration
In Step 6, segment your POS reporting by individual sales associate and shift window. In brick-and-mortar retail, top-quartile associates routinely post UPTs \( 0.45\text{ to }0.80\text{ units} \) higher than store median simply by carrying a complementary accessory into the fitting room and using a natural, value-added pairing prompt at the register (e.g., "Since these suede loafers are unsealed, would you like me to toss in the $12 rain protector spray so they're ready for the weekend?").
For e-commerce stores on Shopify, set your dynamic Free Shipping progress bar at:
$$ T_{\text{free\_ship}} = \lceil \text{AOV}_{0} + 0.85 \cdot \text{AUR}_{\text{addon}} \rceil $$If your current AOV is $58 and your core add-on item is $18, setting Free Shipping at $75 forces single-item shoppers to add one companion unit to unlock free shipping, lifting online UPT by 24% to 38%. Model your exact category margins, multi-buy tiers, and UPT targets in our interactive Retail Margin Calculator.
When auditing retail units per transaction upt formula across real-world operating environments, always log both baseline and post-calibration telemetry in a versioned configuration sheet. Small deviations in ambient temperature, supply voltage, mounting geometry, or input cadence compound nonlinearly across multi-hour or multi-month cycles. By combining the closed-form mathematical equations above with the side-by-side benchmark matrix and the five-point verification protocol below, operators eliminate guesswork and protect long-term return on capital across retailmargincalculator.com workflows.
5. Frequently Asked Questions (FAQ)
What is a good Units Per Transaction (UPT) benchmark for specialty retail?
Across brick-and-mortar specialty apparel and footwear, average UPT sits between 1.65 and 1.85 units, while top-quartile stores achieve 2.35 to 2.70+ units. Beauty, pet specialty, and hardware stores typically average 2.50 to 4.20+ units per transaction.
What happens if UPT goes up but Average Unit Retail (AUR) goes down?
Because AOV = UPT x AUR, adding lower-priced impulse accessories ($10–$18) at checkout naturally lowers blended AUR slightly while increasing UPT and total AOV. Always evaluate success by Gross Margin Dollars per Transaction (GM$/tx), not AUR alone.
Should customer returns and free samples be included when calculating UPT?
No. Including zero-dollar samples artificially inflates UPT without revenue, and ignoring returns overstates net basket size. Always calculate Net UPT using net units sold divided by net completed transactions.
6. Standard Operating Verification & Audit Checklist
Before locking in your final configuration or production parameters for retail units per transaction upt formula, execute this five-point verification protocol to ensure repeatable field performance:
- 30-Day Net POS UPT Baseline Extraction: Export the last 30 days of POS receipts, subtract returned units and free samples, and compute baseline UPT by day of week and cashier.
- Single-Item Receipt Share (%1-Unit Basket) Audit: Calculate the percentage of total store receipts containing exactly 1 unit; if single-item baskets exceed 55%, prioritize checkout attach training.
- High-Margin Companion Adjacency Mapping: Pair each top-10 anchor SKU with a 65%+ gross-margin consumable or care accessory displayed within arm's reach on the sales floor and at the register.
- Multi-Buy Tier Break-Even Margin Verification: Verify that every 'Buy 2 / Buy 3' promotional discount tier exceeds the Break-Even UPT formula before printing shelf signage.
- Dynamic Free-Shipping Progress Bar Calibration: Set e-commerce free-shipping thresholds 15% to 25% above current median AOV and verify margin impact in the Retail Margin Calculator below.
Model Your Exact Parameters & Tolerances
Run your custom numbers through our interactive engineering and financial calculator to verify your setup in real time.